Getting started
Learn how to store and view your first events
This guide goes through start to finish storing your first event and viewing them in a dashboard.
Table of Contents
Getting setup
To get started on trckrspace, register an account at https://app.trckrspace.com (opens in a new tab). Once logged in, you will be prompted to setup your first application.
An application isolates events, dashboards and API keys all related to one application. You can setup multiple applications for different environments, websites or even different use-cases.
The dashboard
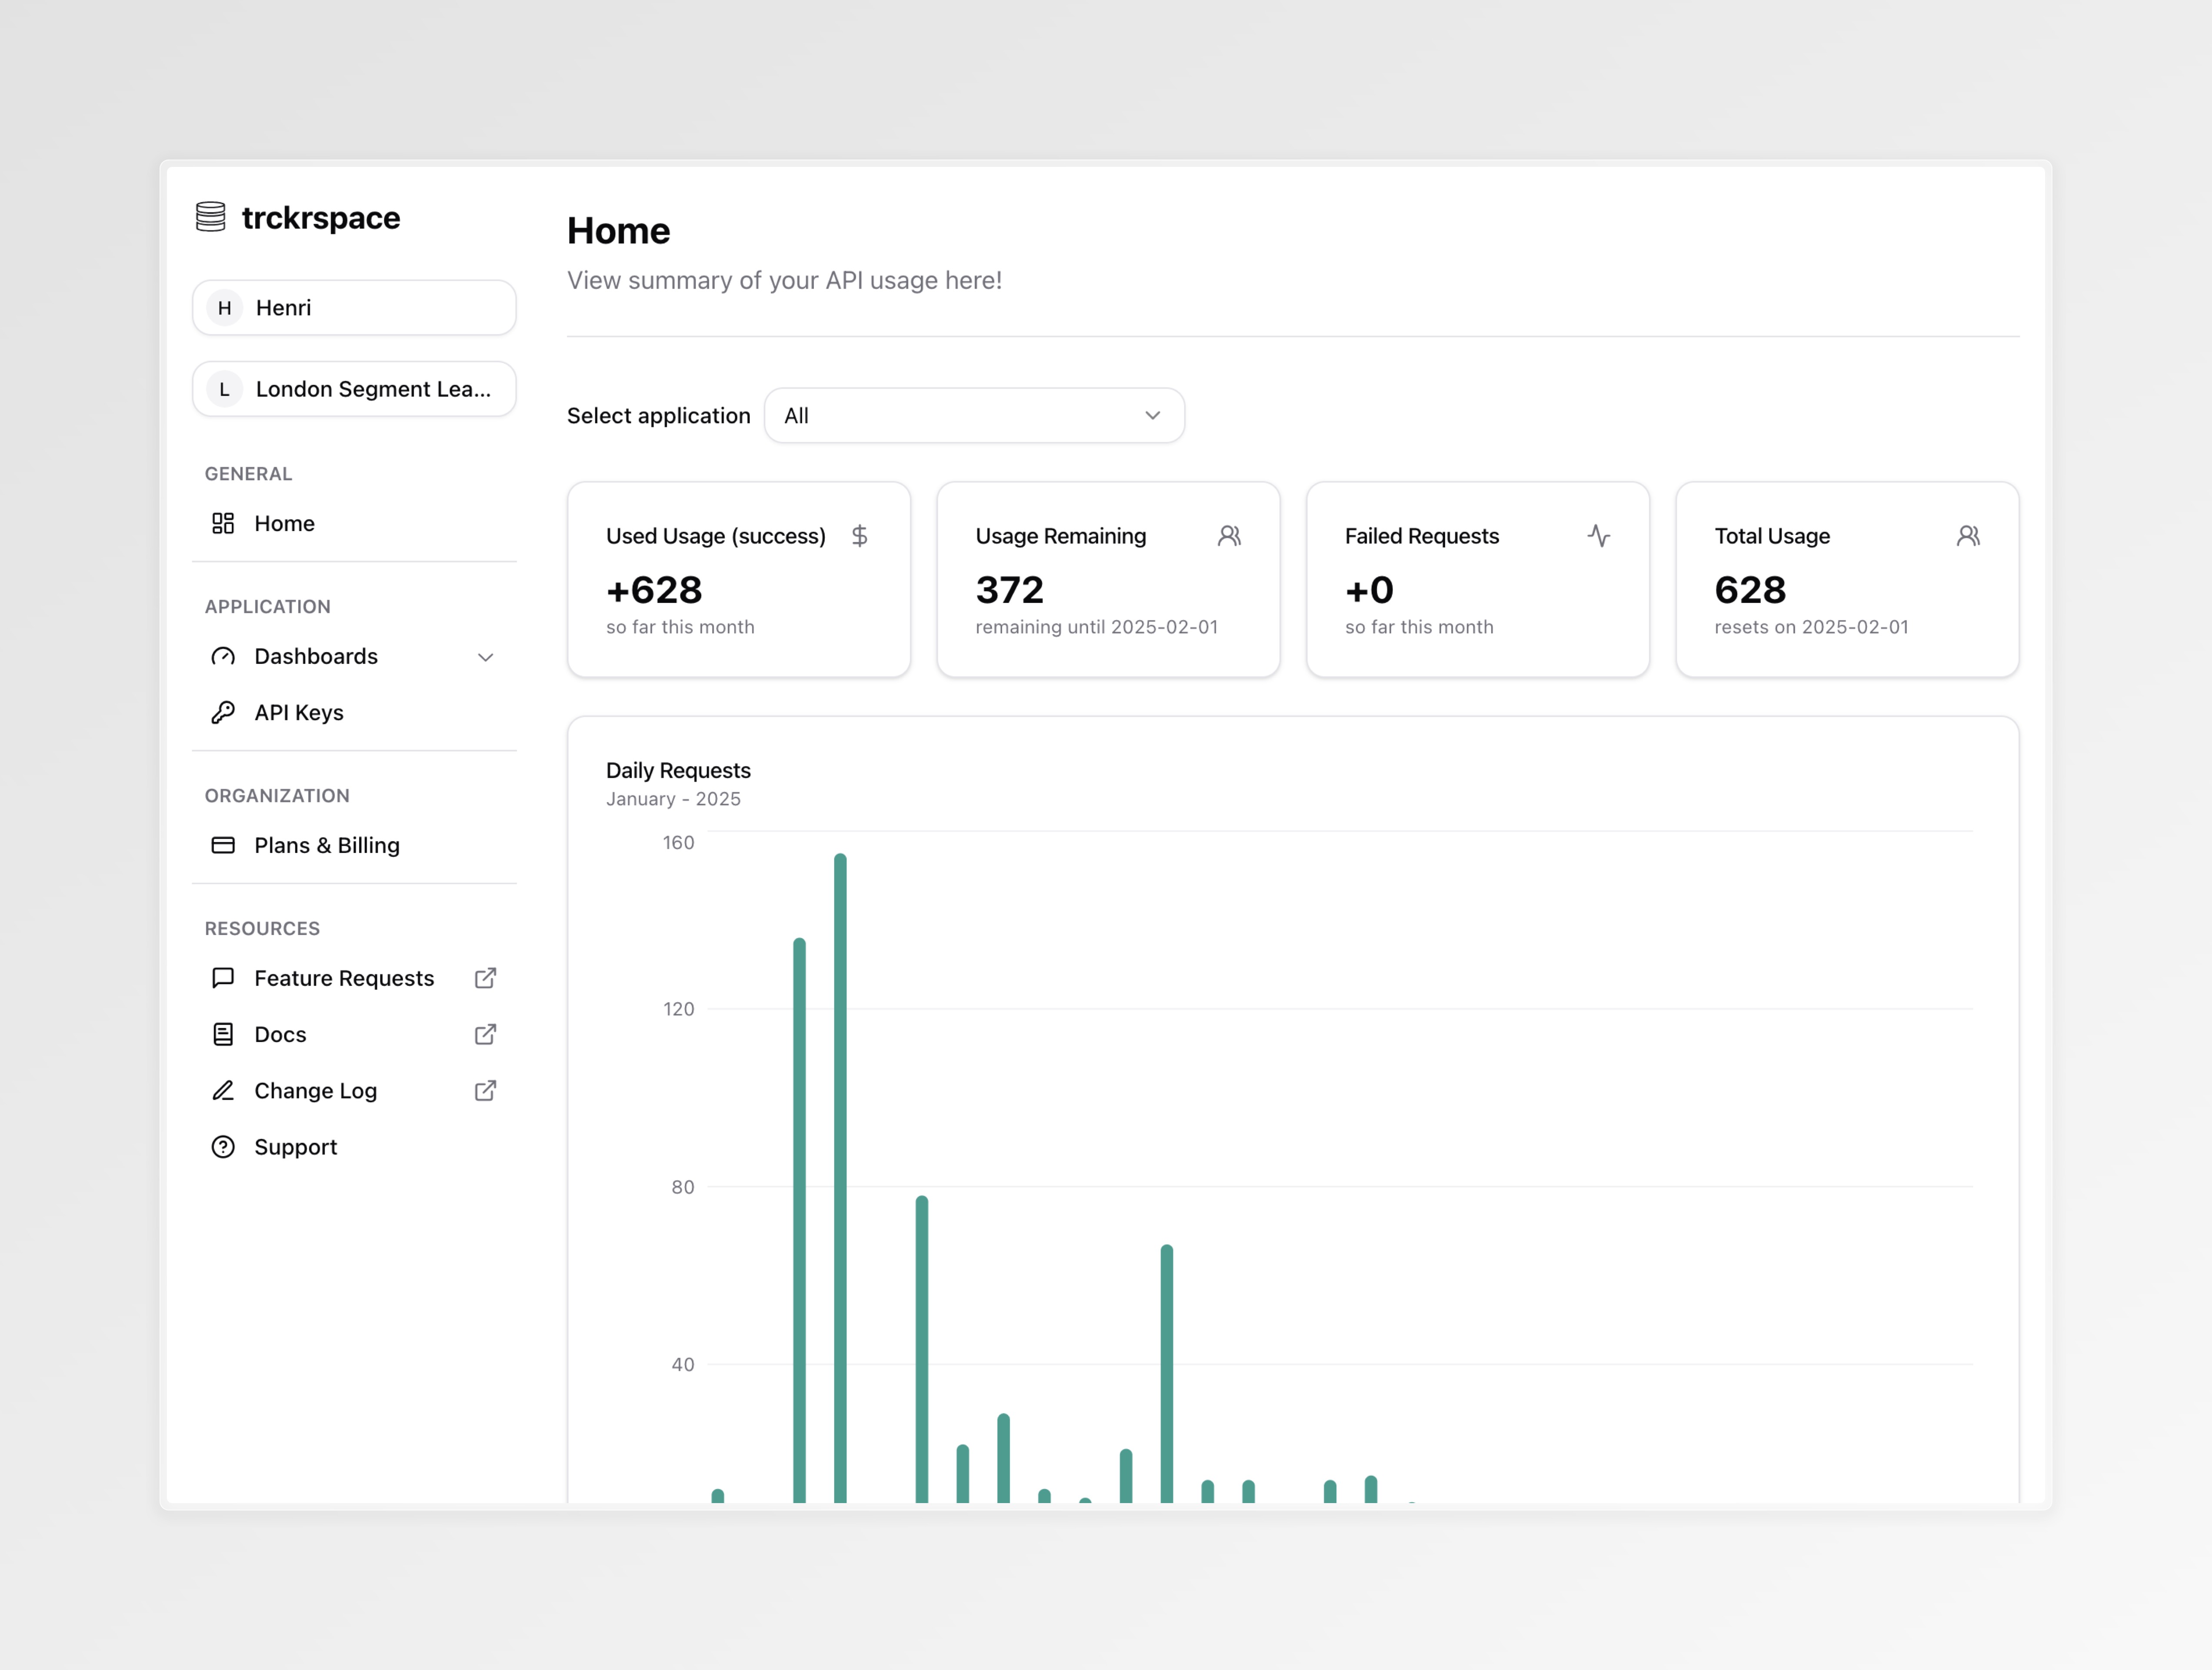
When first logged in, you will be presented with your usage dashboard. Here you can track how many events you have sent to trckrspace over the current month, you can also see events on a per-application basis by using the dropdown.
Creating an API key
You need to create an API key to start sending events to trckrspace. An API key is tied to an application, so any events you send using an API key will be stored within that application.
To do this first navigate to the API keys page using the sidebar (highlighted in red):
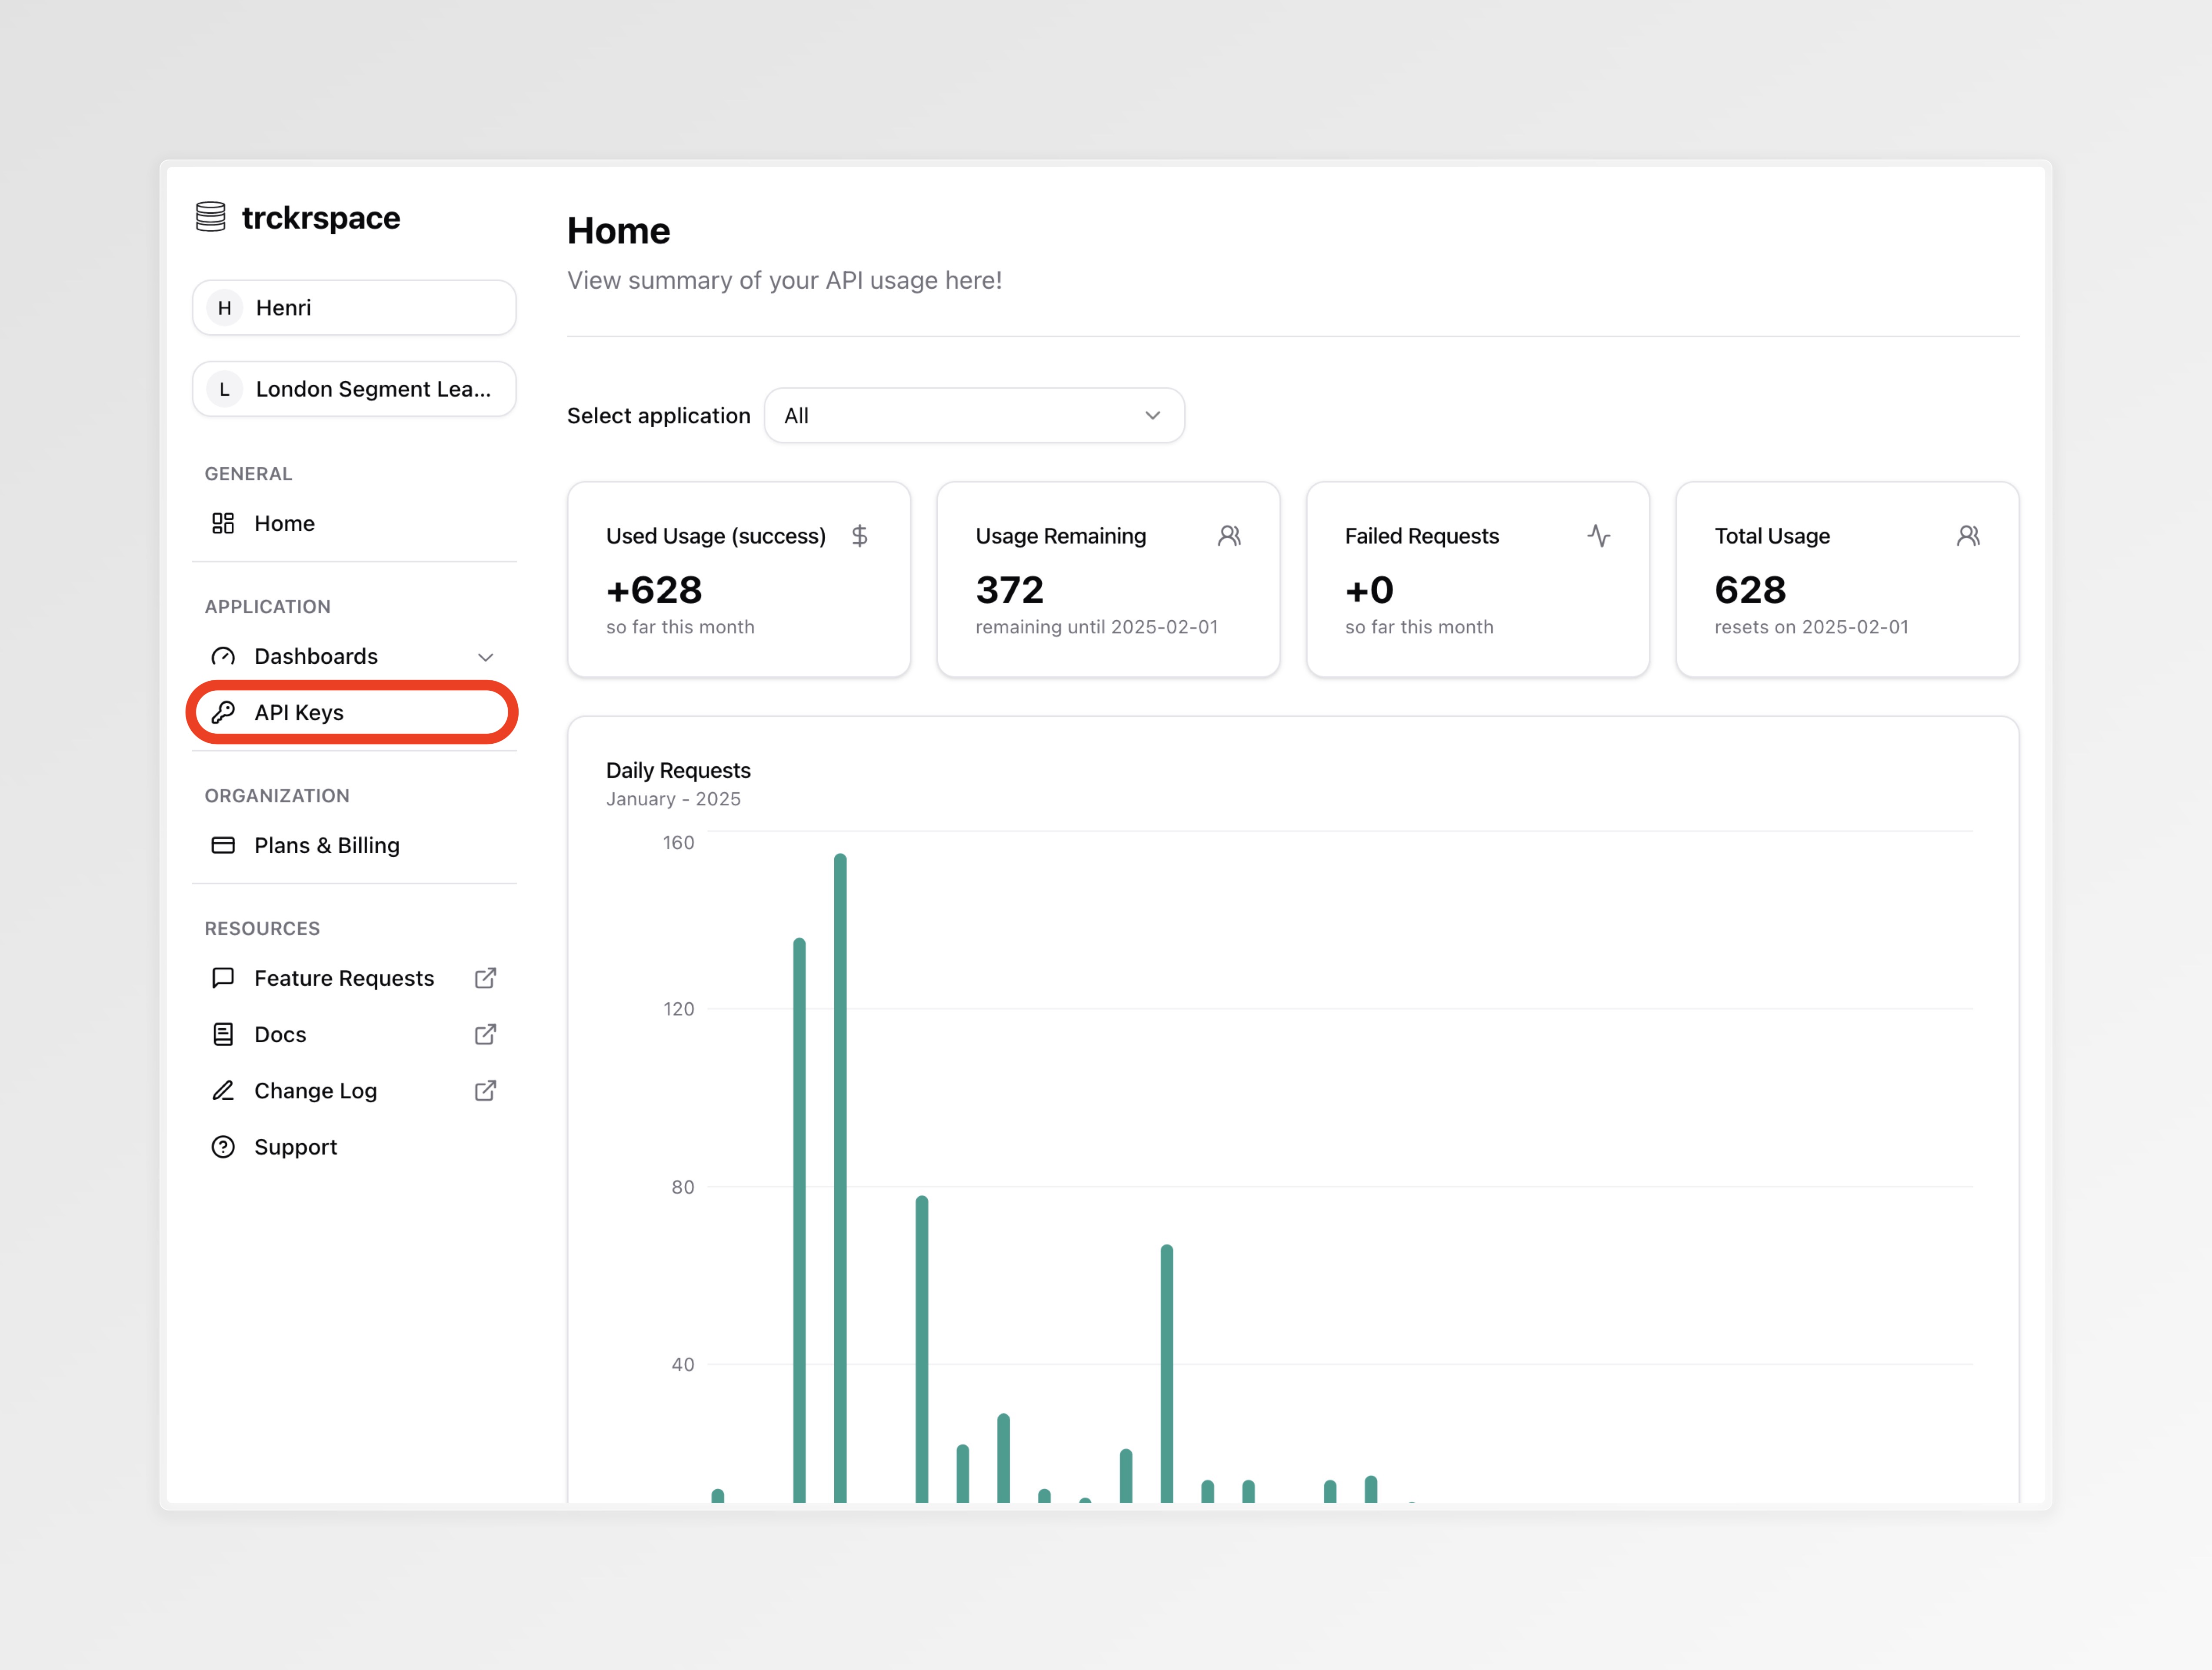
Once on the API Key page, you can click the "Create API Key" button to create your first API key.
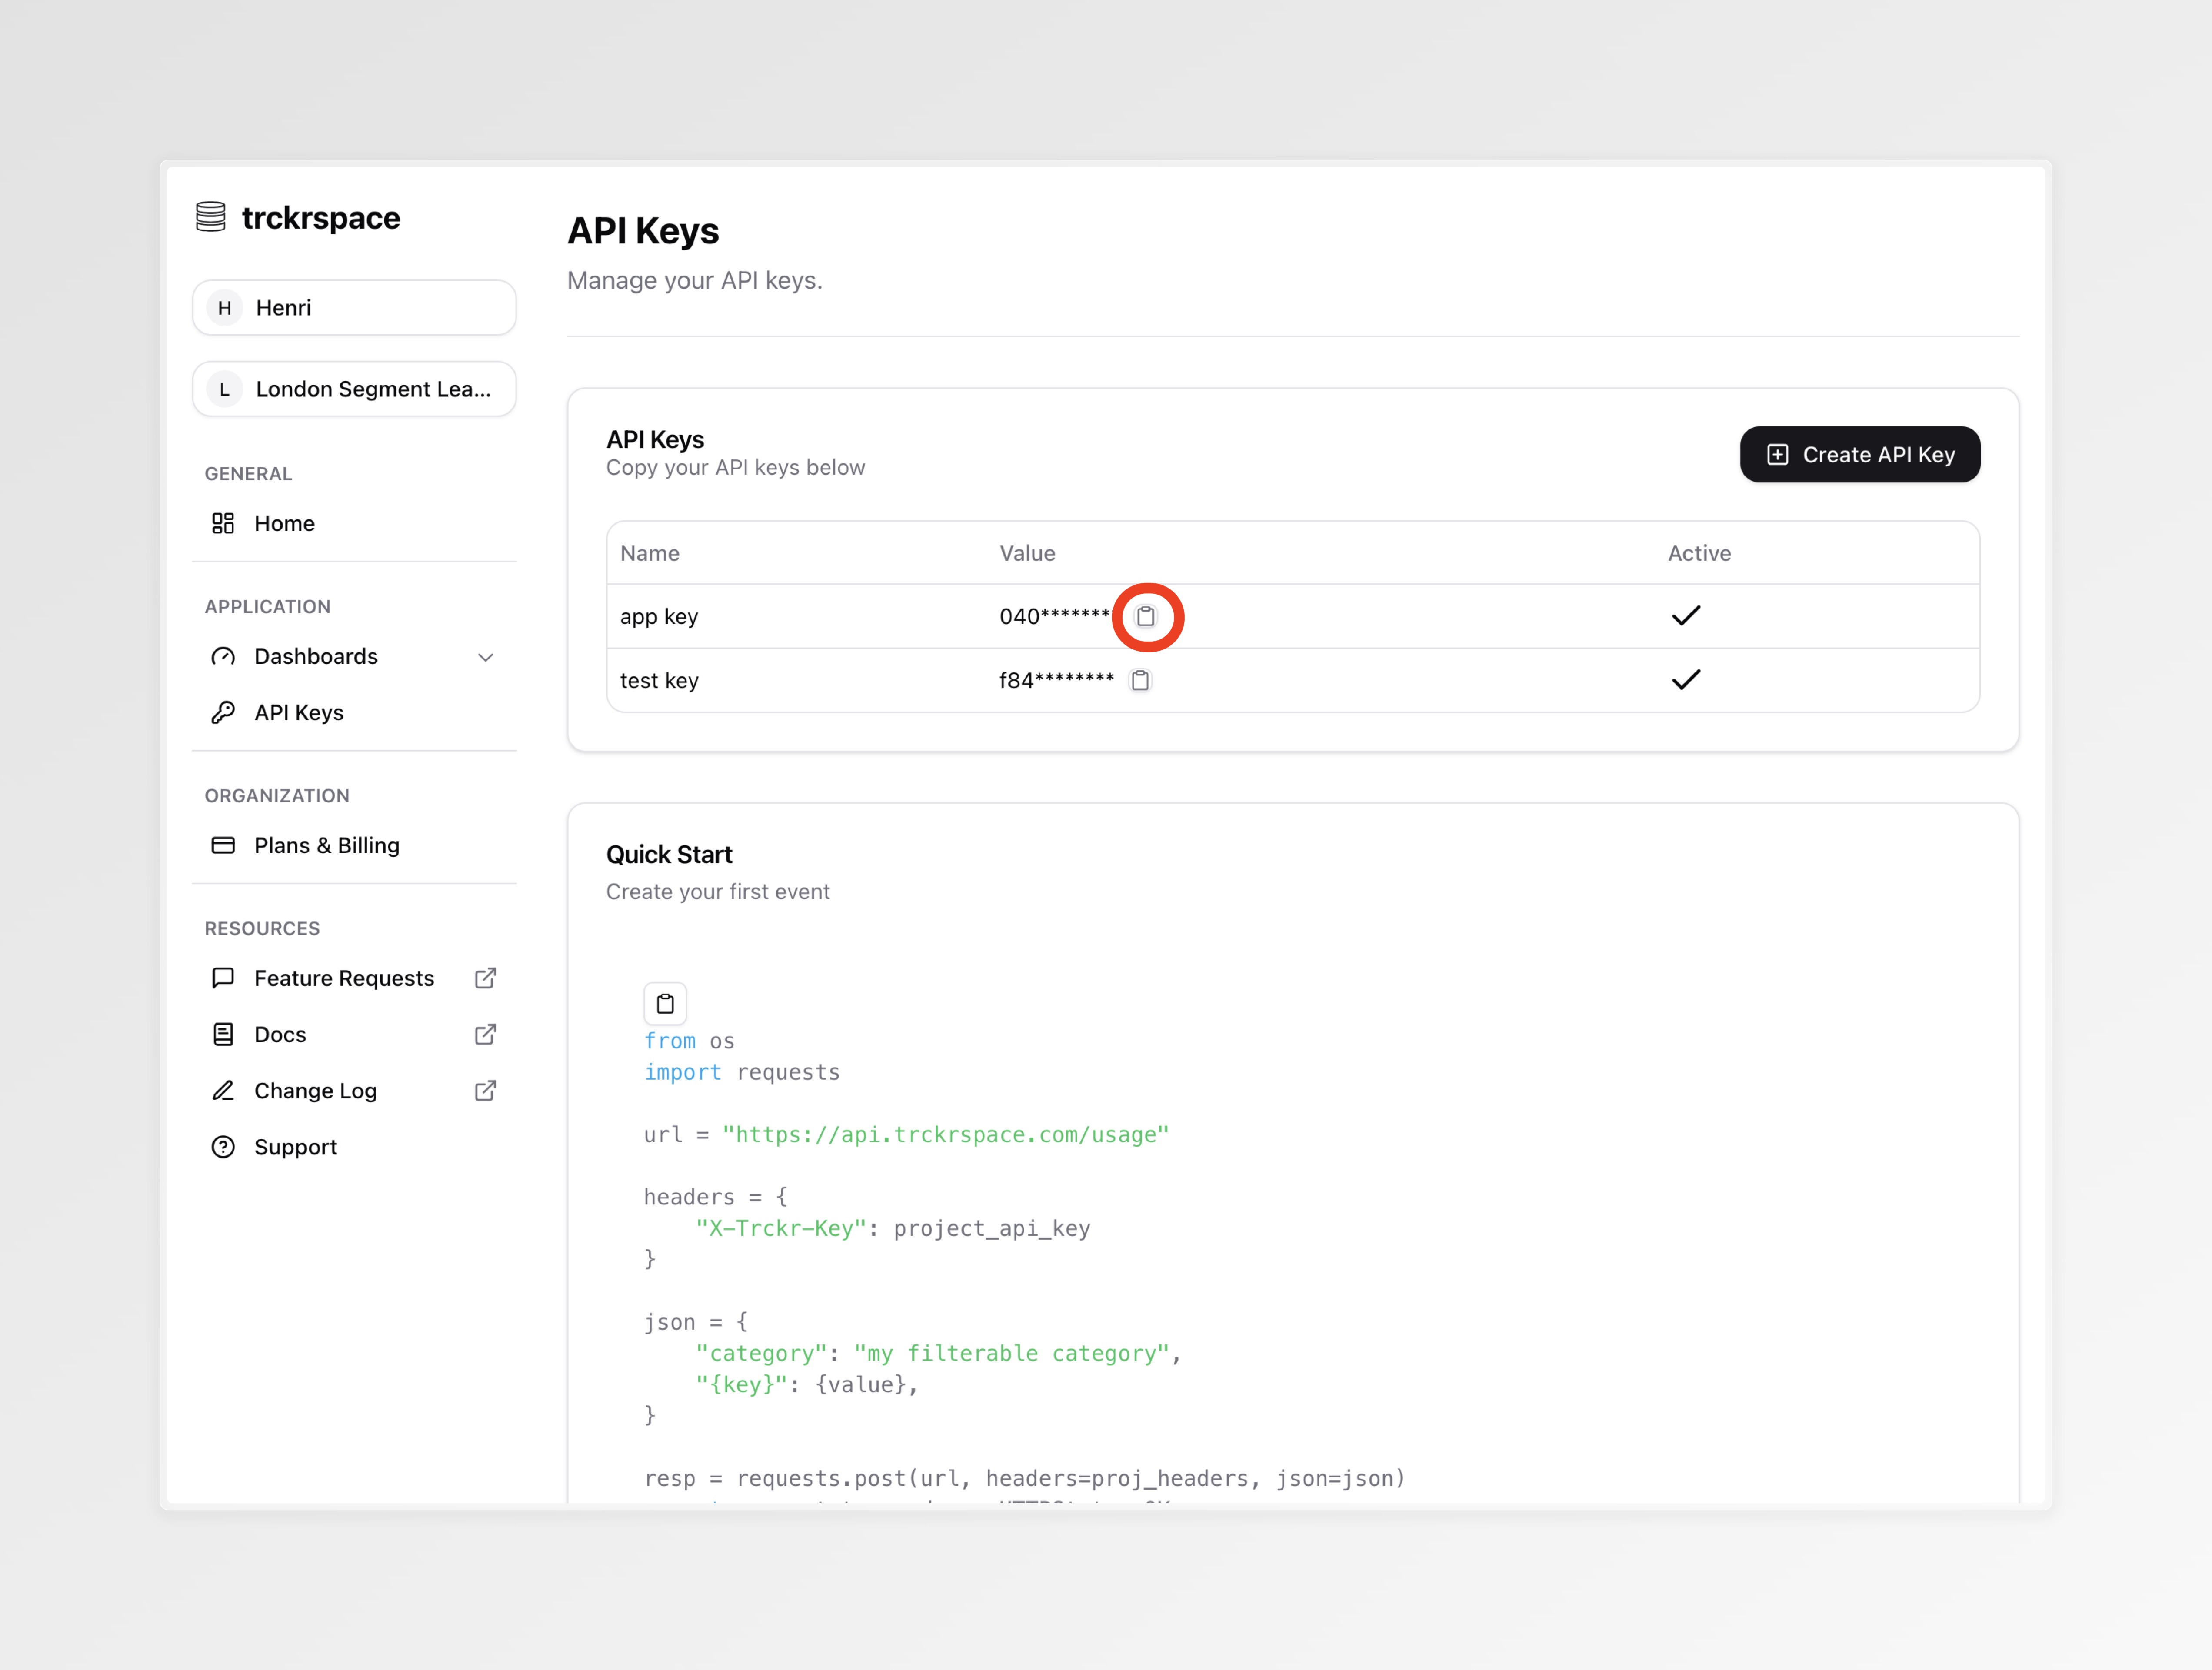
After creating the API key, you will see it appear in the table at the top of the page. To get the API key value you can click the copy button (highlighted in red below) to save it to clipboard so you can later paste it.
Collecting your first event
You are now ready to collect your first event in trckrspace. The API provides
one POST endpoint which has one required key category. Categories are used
later as one way to filter your data and segregate different categories of
events.
Other than category you are free to add any additional json serializable
key-value pairs.
You are also required to include your API Key in a header x-api-key, this is
so your event can be associated with the correct trckrspace application.
Below is a python example:
import requests


url = 'https://api.trckrspace.com/usage'
api_key = "{ insert your key here }"
headers = {
    'X-Api-Key': api_key,
}


event = {
    'category': 'authentication',
    'event': 'user-sign-in',
    'userId': '123456789',
    'location': 'London',
    '2fa': True
}

resp = requests.post(url, headers=headers, json=event)
print(resp)

>> <Response [200]>
Viewing your events
After collecting your first event you can start to view them. Viewing events is done in your trckrspace dashboards. To get started navigate to the dashboards section in the navigation bar and click create:
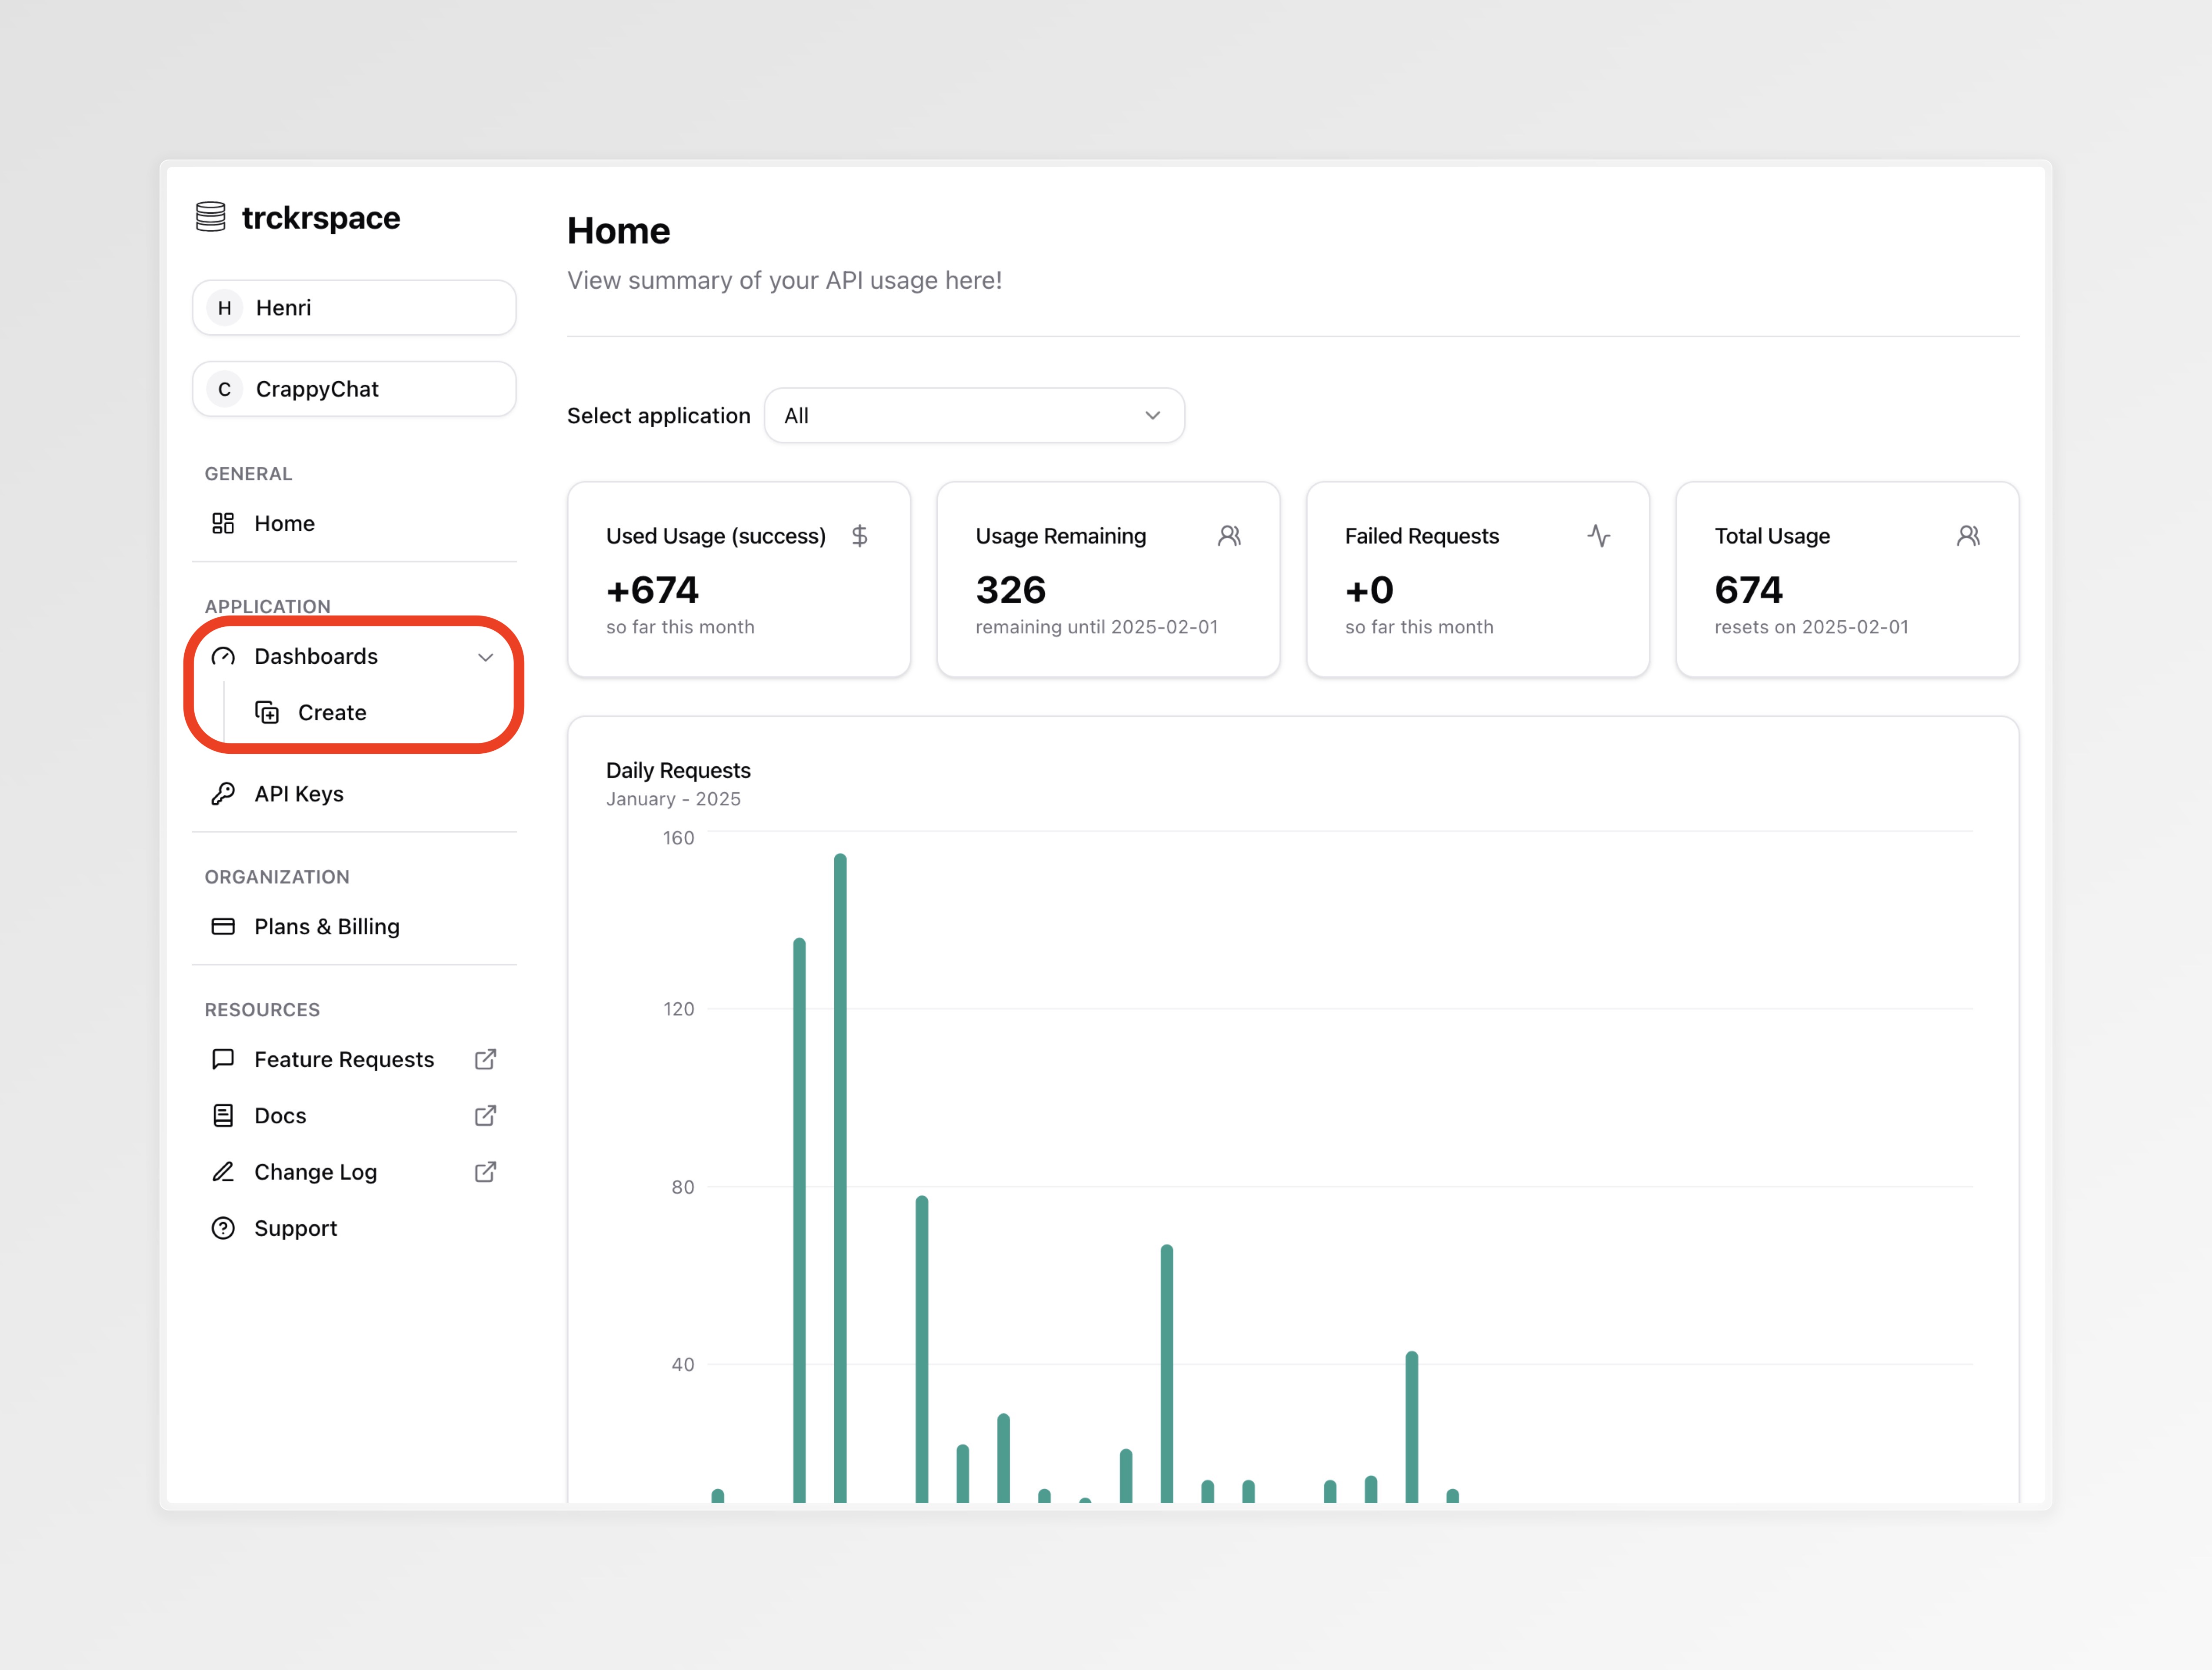
A new dashboard will be created for you, you can edit the title and description by click and typing in the text box:
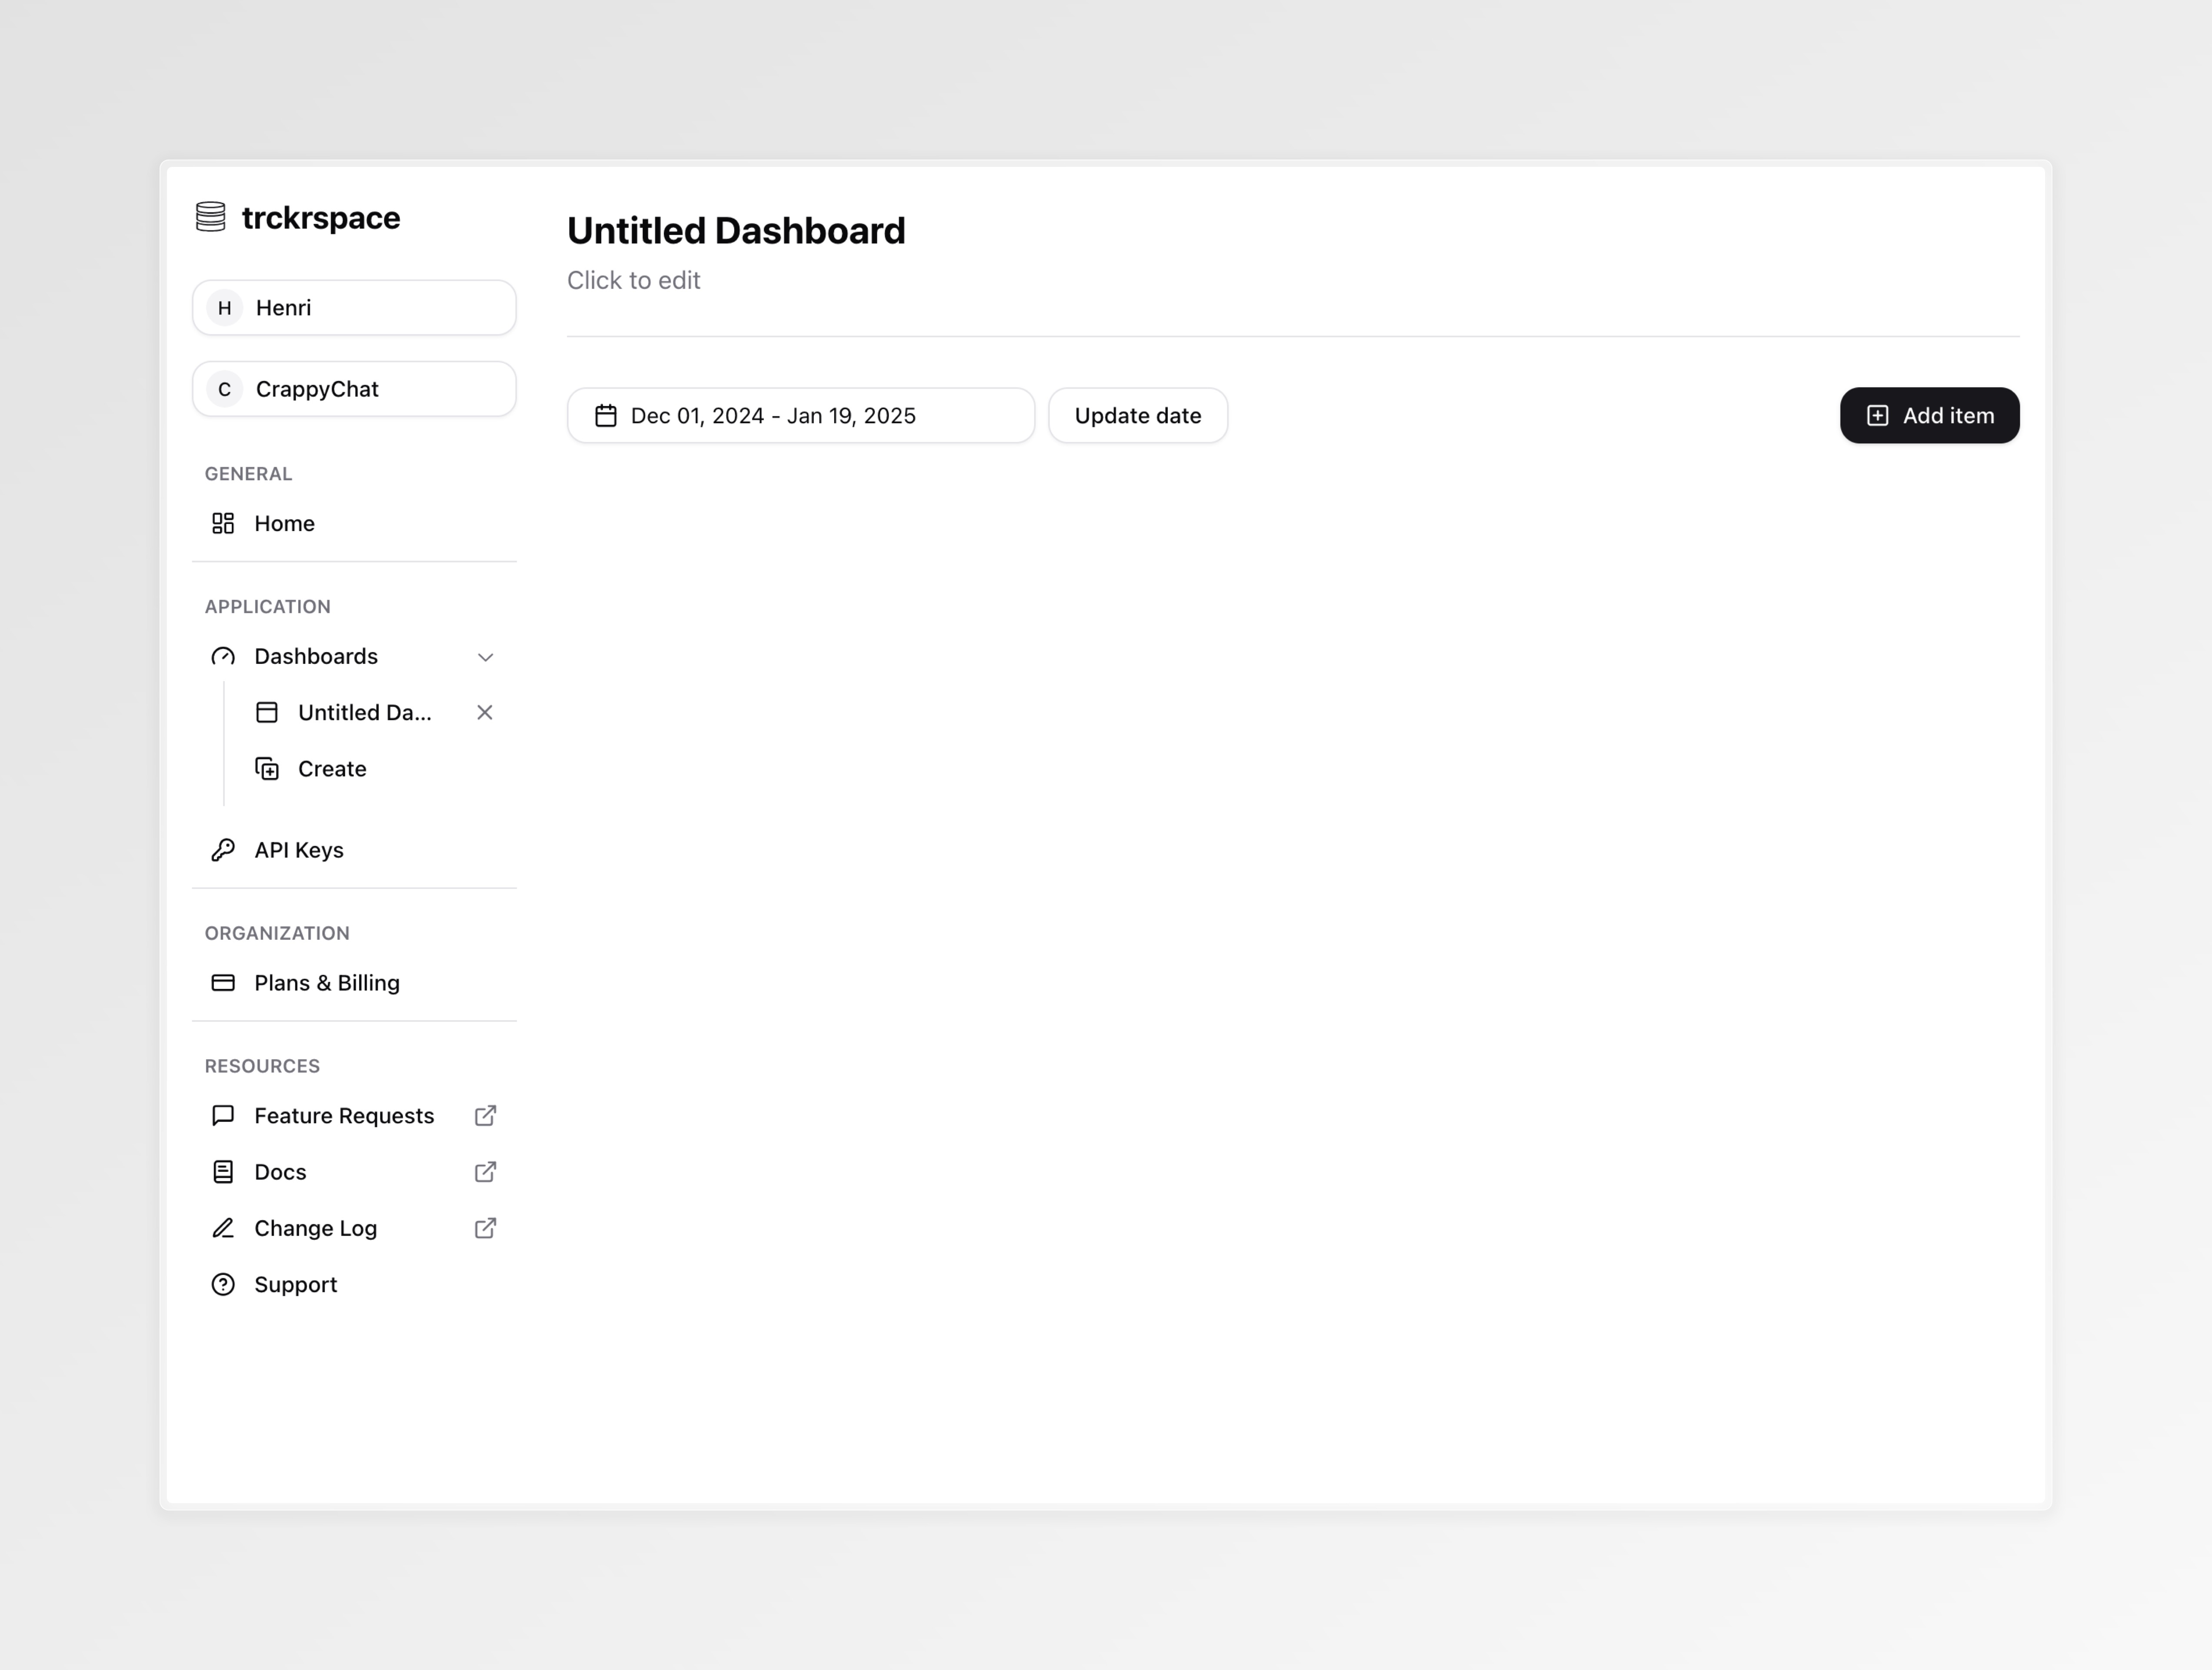
To first events, select a date range for events in your dashboard by selecting
a start and end date (red) and finally add items to your dashboard (orange):
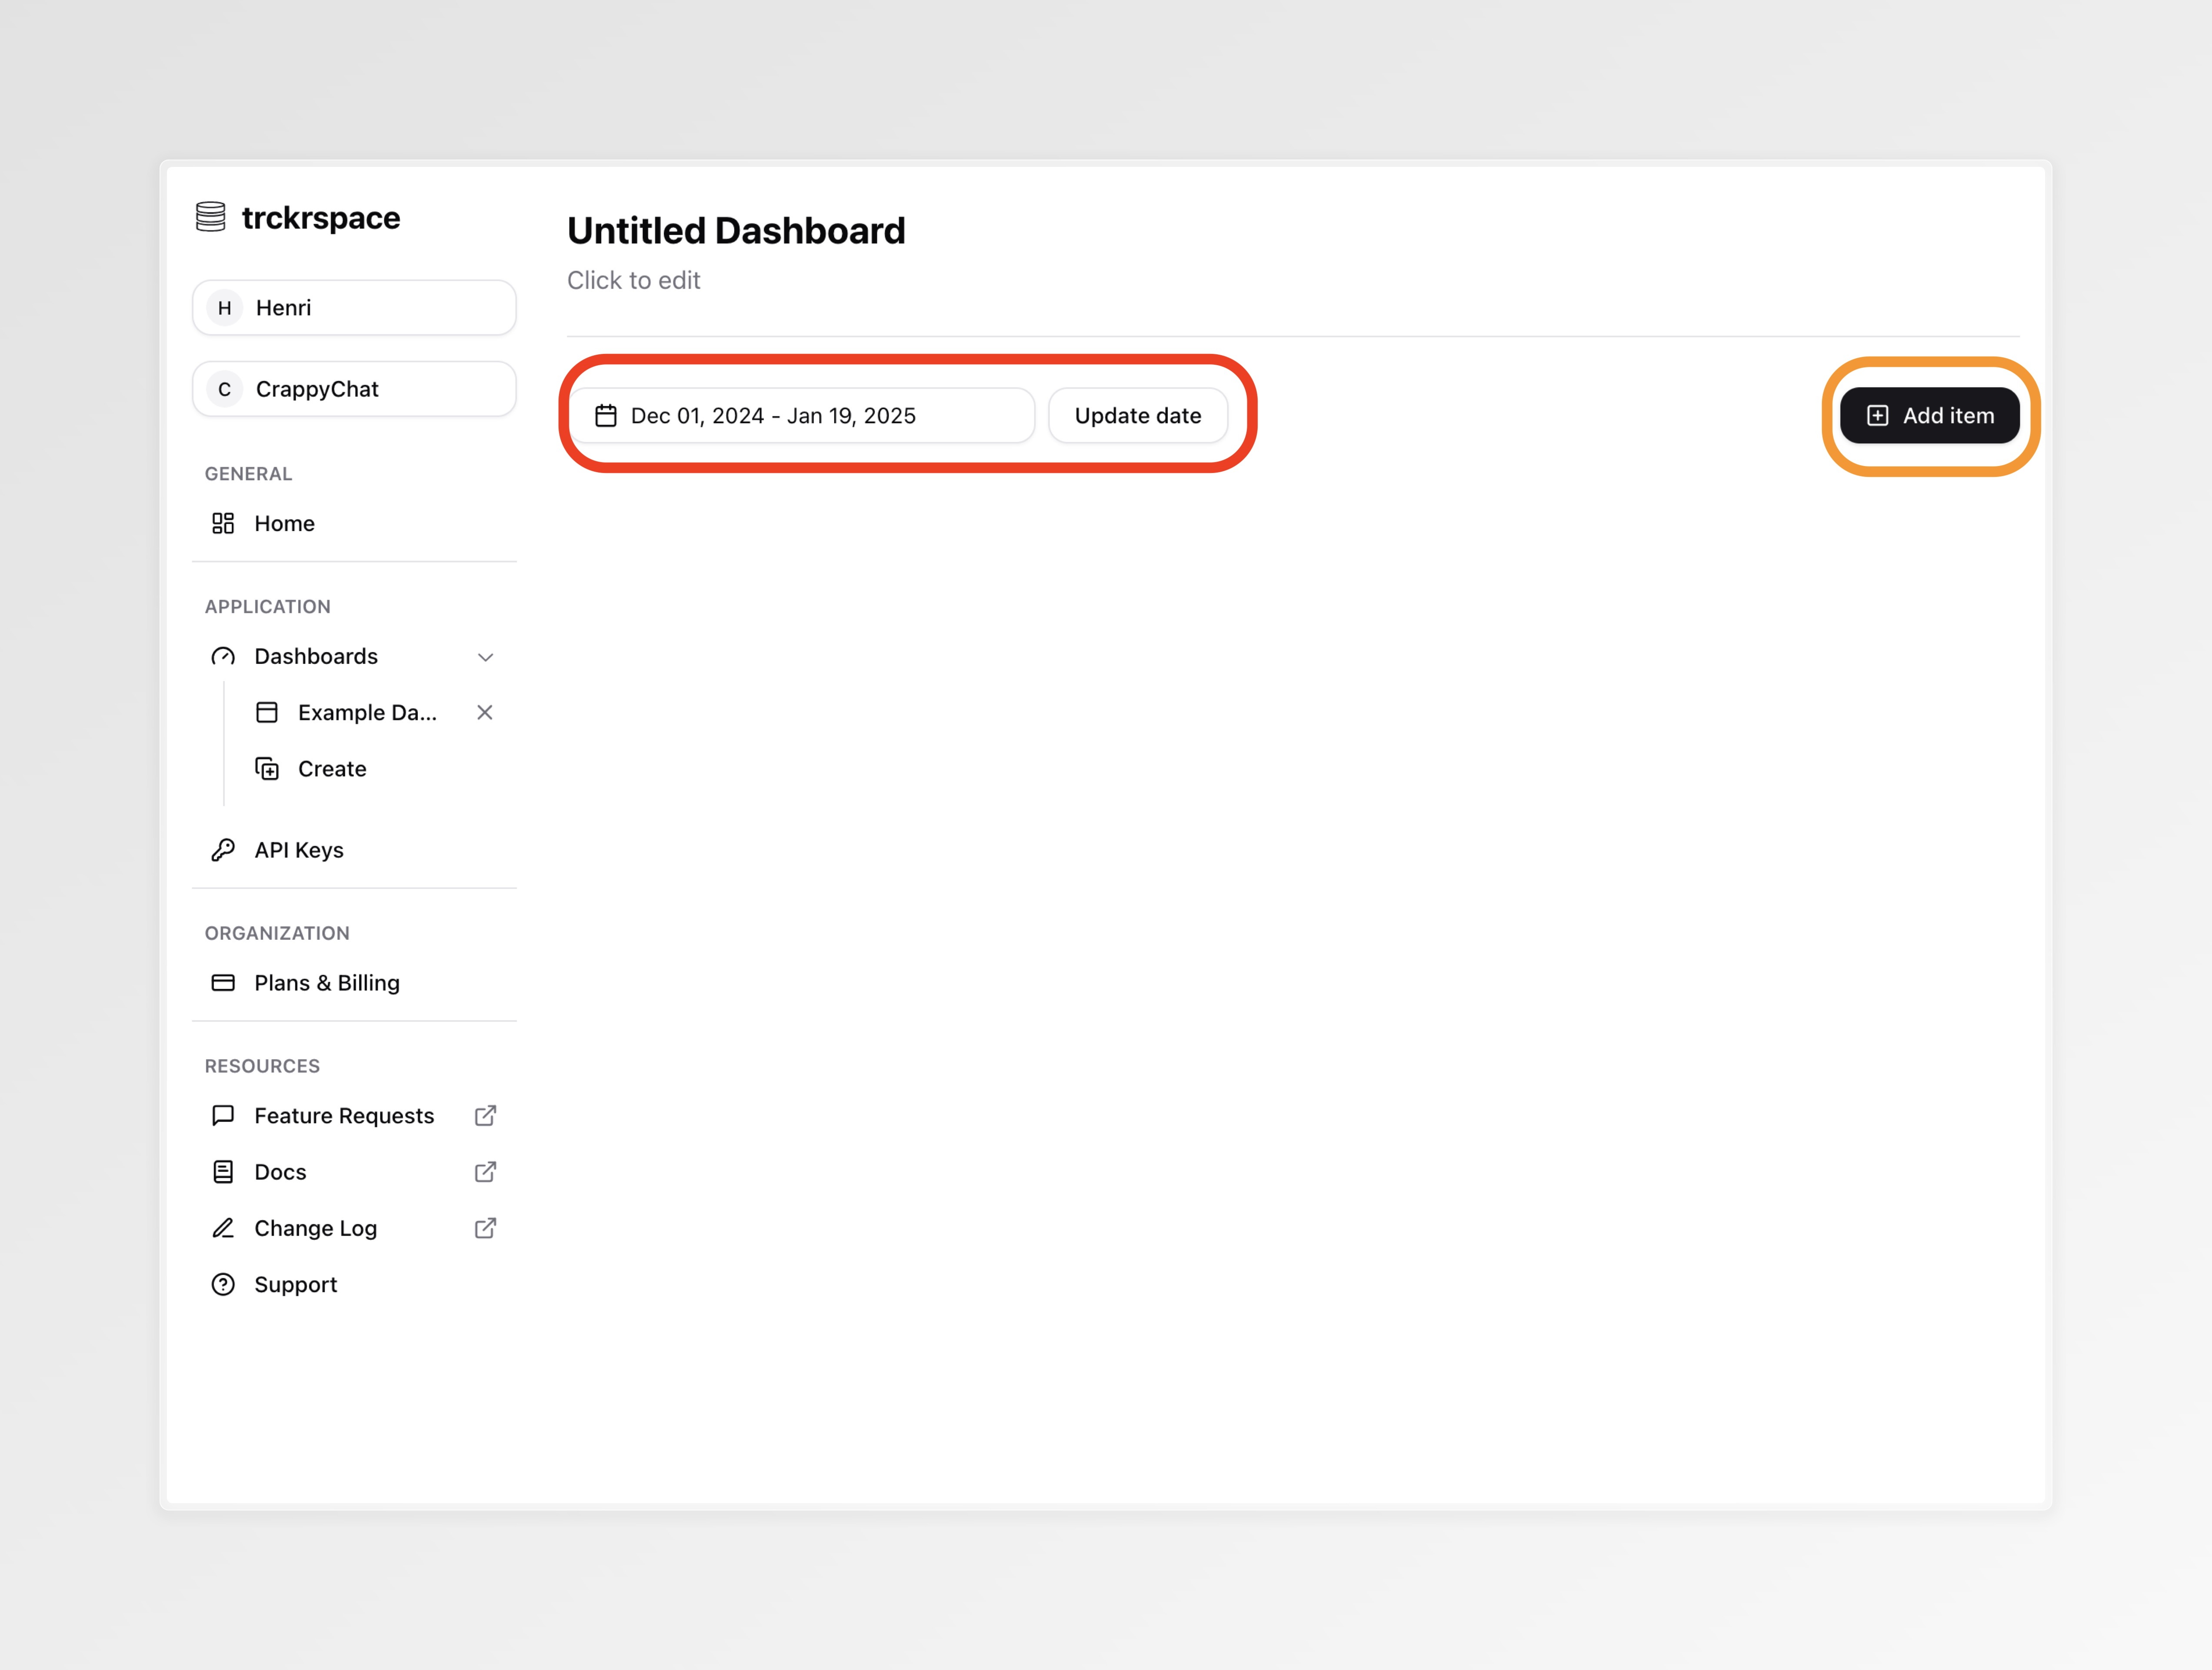
We support multiple dashboard items which present your events in aggregated or raw.
Let's create 2 dashboard items for this demo - a bar chart and a data table.
First let's add a bar chart to show the count of events where
event='user-sign-in'. (If you've been following the example you should have
one event like this):
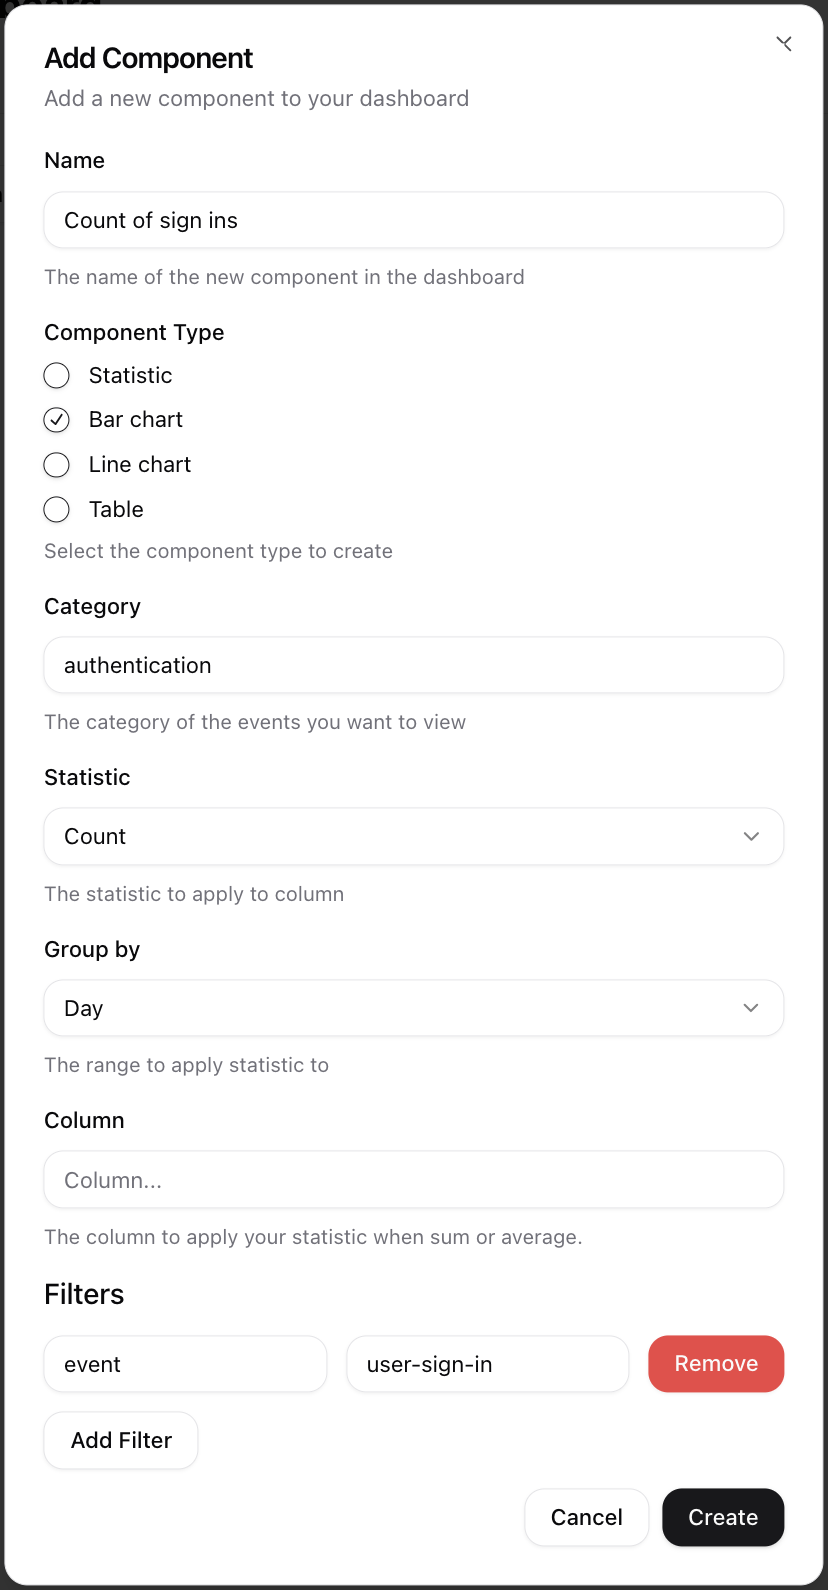
Here we named the component "Count of sign ins" and showed a count of events
each day with category=authentication and added a filter for
event='user-sign-in'. Click create to complete.
Now added a second item the data table:
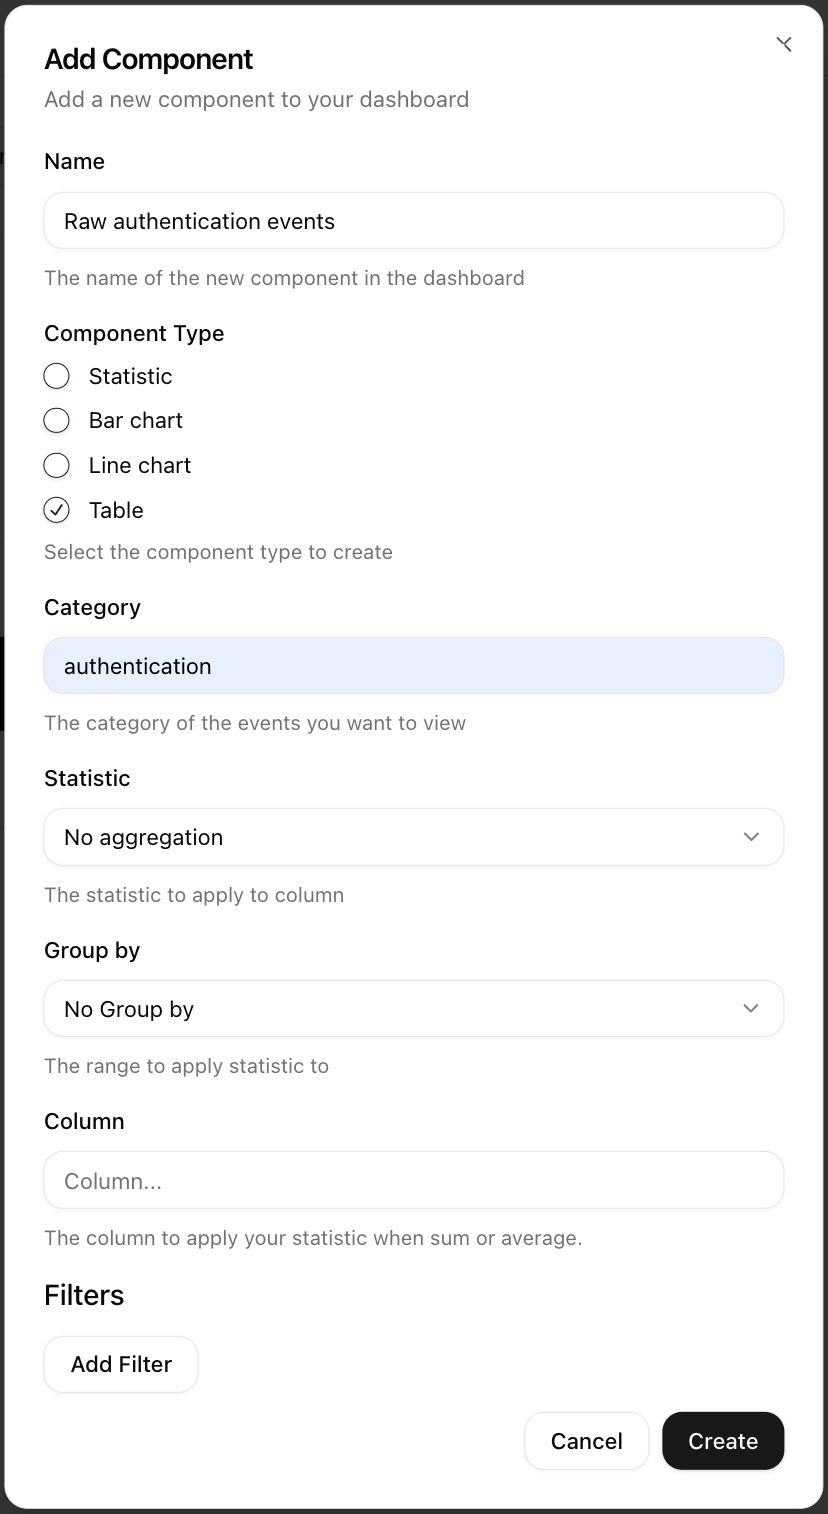
Here I wanted to see the raw data, so I specified no aggregation and did
not add a filter for event.
You should now see a dashboard like this:
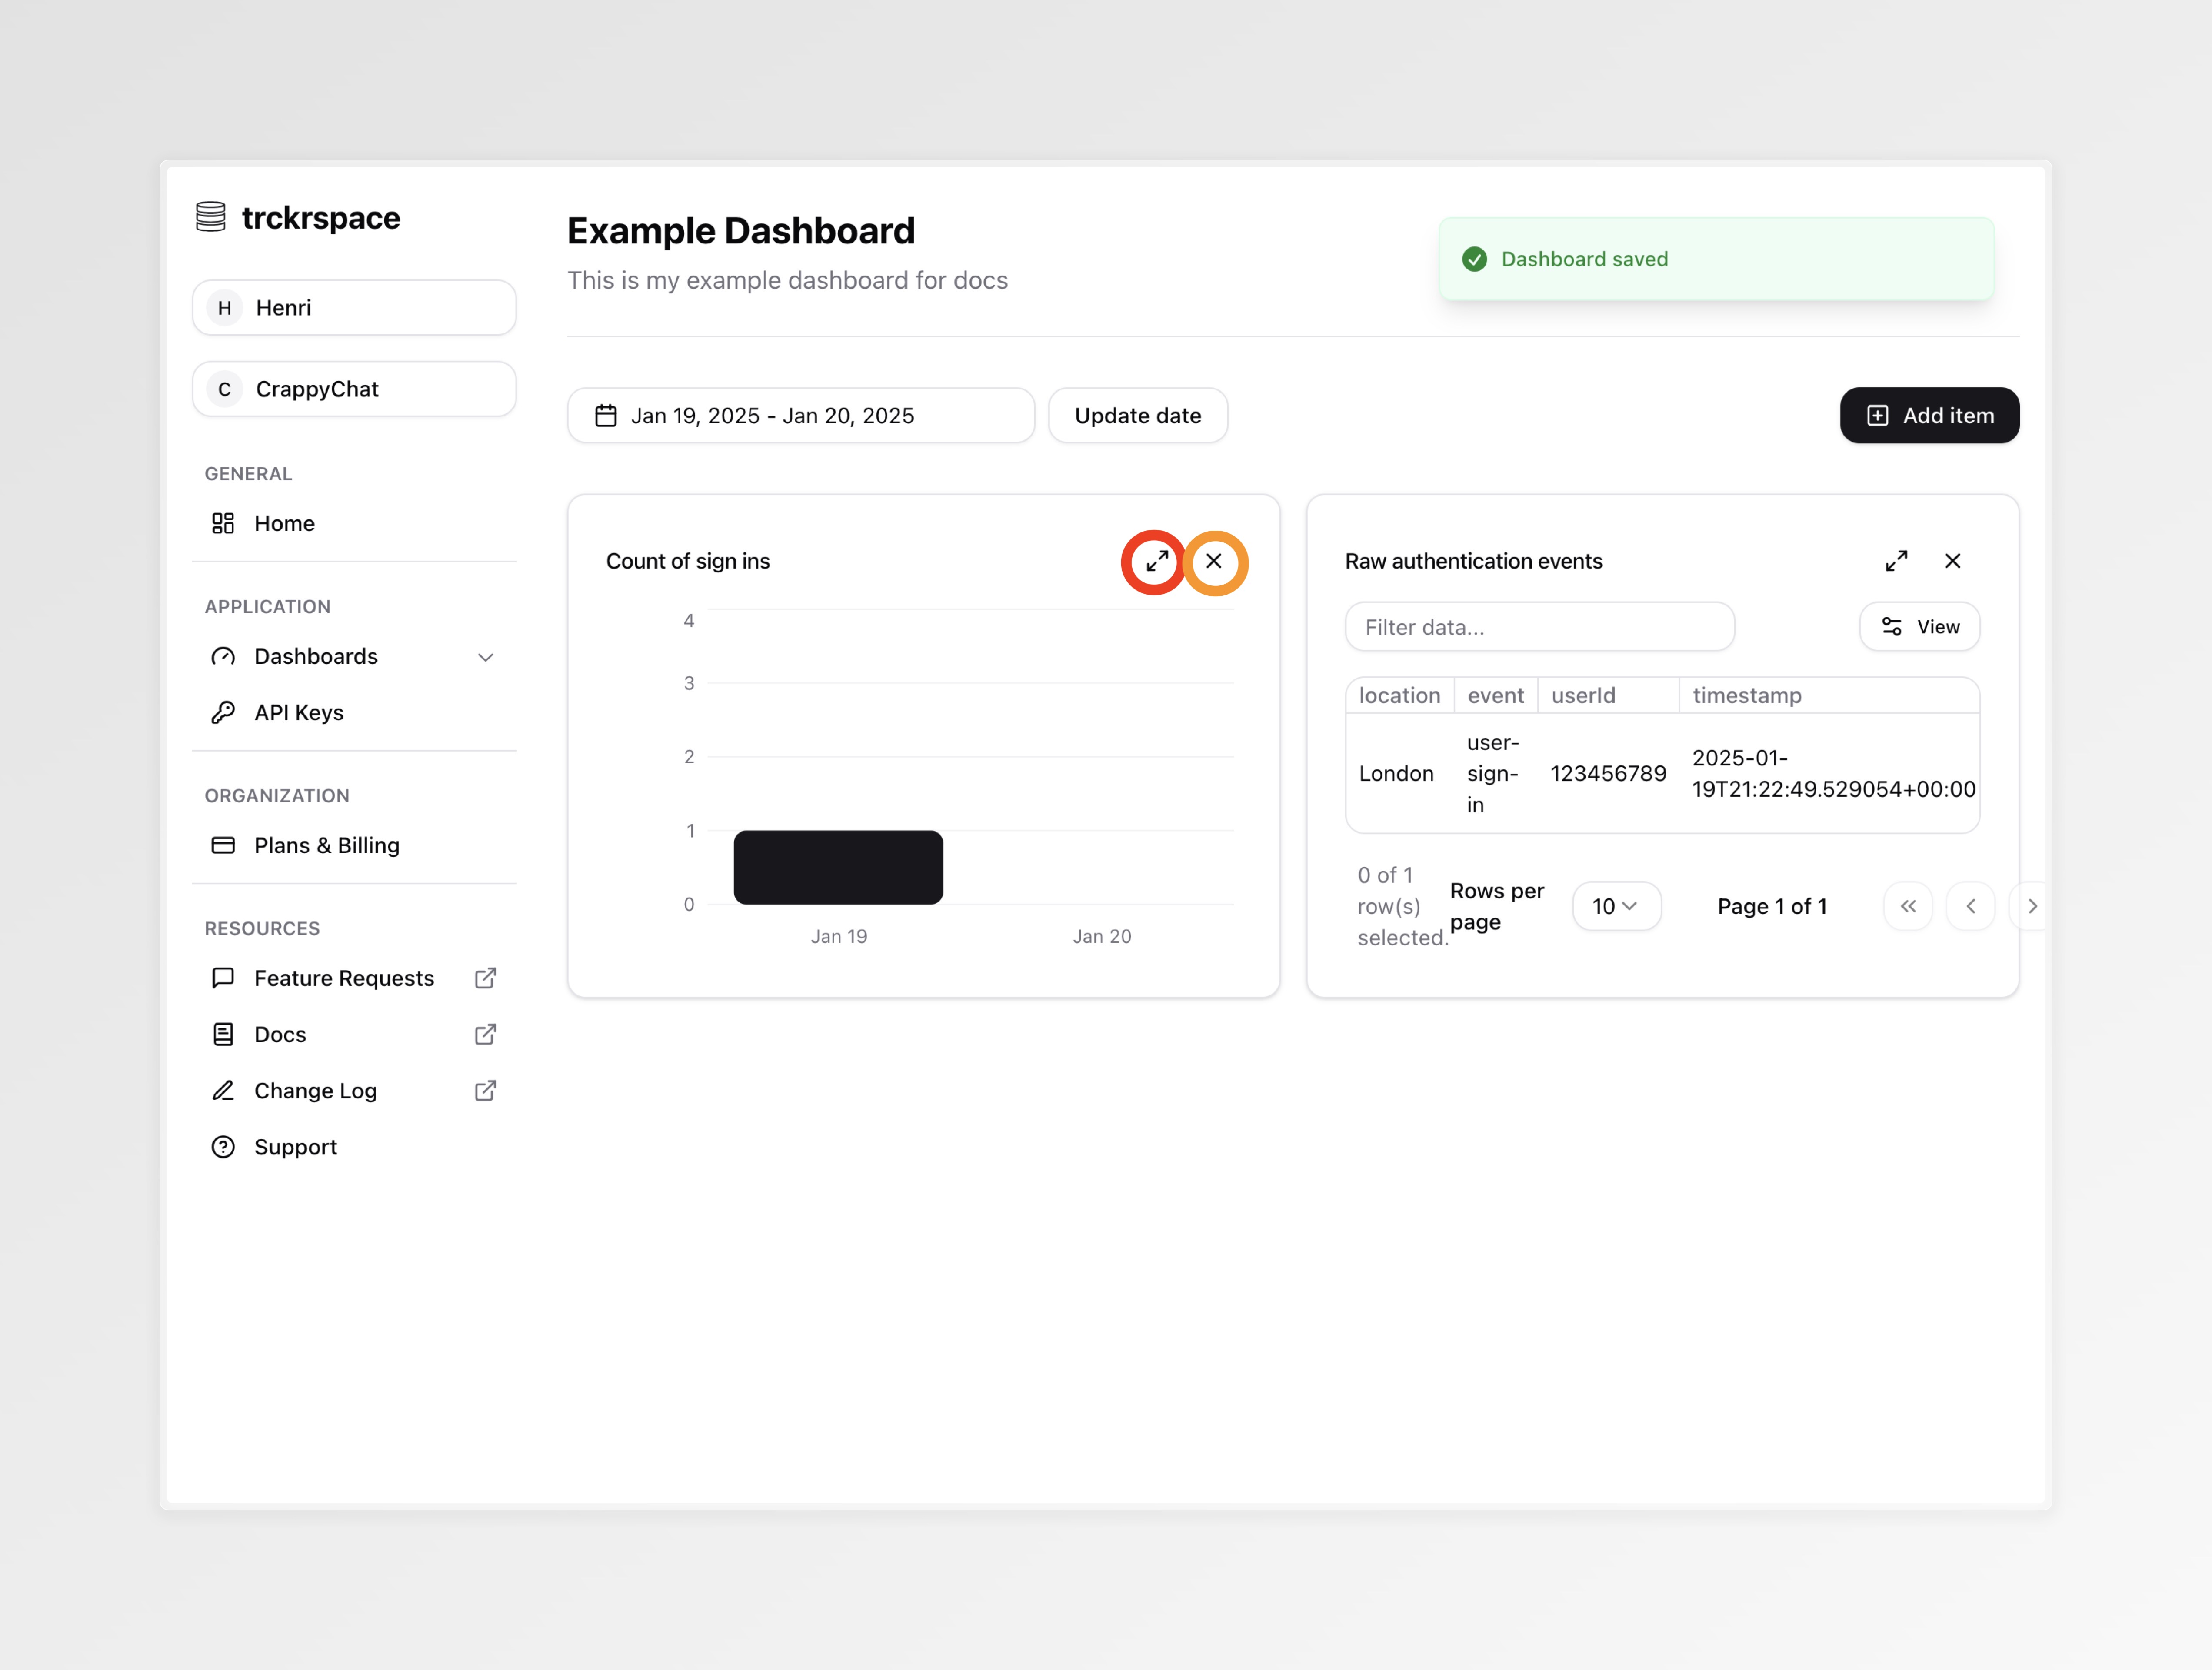
You can re-arrange your dashboard by dragging and dropping items, you can make an item bigger by pressing the expand button (red) and finally remove an item by pressing the delete button (orange).